
7 Marketing Tools That Actually Track ROI for Multi-Location
Summary: The article highlights seven marketing tools that effectively track ROI for multi-location businesses by connecting ad spend directly to production value or clinical outcomes. These tools include Clinads, Medesk, ConvertLens, Swell, Dentrix Ascend, and Cardinal IQ, which offer features like production-validated ROI, native PMS analytics, predictive models, reputation-based revenue attribution, and comprehensive EHR connections to provide accurate, location-specific profitability insights.

Introduction
Most DSOs are burning budget on offices that look profitable on paper. The problem is that an aggregated dashboard masks the one location quietly posting a $150 to $300 patient acquisition cost while the rest of the group averages $200. One underperforming site inflates your group numbers, and without location-specific PAC and LTV tracking, you are paying for that failure monthly. In 2026, that blind spot will cost you tens of thousands in wasted ad spend.
When practice managers account for all inputs rather than just their ad spend, the true PAC is often 30 to 60 percent higher than they initially estimate. The trade-off: you either get granular per-office attribution or you get a clean-looking report that hides a profitability leak. This article breaks down seven tools that force each location's true marketing cost into the open, ranked by how well they solve that specific problem.
Key Takeaways
The tools that matter in 2026 connect ad spend directly to production value or clinical outcomes, not just lead volume. Here is what separates the operational from the ornamental:
- Production-validated ROI is the new standard: Tying marketing spend to practice management system production data, as Clinads does, eliminates the lead-count vanity metric and shows cost-to-revenue per office.
- Native PMS analytics delivers the most reliable LTV: Medesk links marketing source directly to completed treatment value, giving you a true per-patient revenue number without third-party data gaps.
- Predictive models shift budget before the loss occurs: ConvertLens moves beyond reactive reporting to forecast per-location saturation, letting you pull spend from a drying market before your PAC spikes.
- Reputation is a quantifiable acquisition channel: Swell attributes high-value case starts to specific office review scores, turning a soft metric into a hard revenue line.
- The EHR connection closes the loop: Dentrix Ascend traces a PPC click through to diagnosis, acceptance, and total patient spend, building a complete marketing-to-clinical ROI model.
- Enterprise DSOs need a normalization layer: Cardinal IQ aggregates data from disparate PMS brands into one centralized view that compares true per-location profitability side-by-side.
1. Clinads: Unified Multi-Location Attribution & Production-Validated ROI

Clinads answers the question most multi-location marketing reports dodge: which offices are actually making money from the spend. It does this by matching marketing activity against real production data pulled straight from the practice management system.
Most attribution stops at the lead. A form fill, a phone call, a booked appointment. Clinads keeps going. It pulls closed treatment revenue from the PMS so the number on the screen is what hit the ledger, not what hit the CRM. When a campaign generates 200 leads across 12 locations, the dashboard splits that into revenue per office, not a blended average that hides the three locations burning budget.
A marketing director can log into one interface and scan cost-to-revenue ratios for every location at once. The office running a 3x return sits next to the one losing money; there is no report to request and no spreadsheet to merge. The difference is immediately visible.
The platform tracks the path from click to chair without handoffs that drop the thread. Booked appointments that turn into completed treatment stay connected to the original channel, so the attribution picture does not fray halfway through the patient journey.
Clinads was built for groups managing dozens of offices, each with its own local competition and spend level. It was not adapted from software designed for a single practice and later stretched across a DSO. That distinction shows in the dashboard structure, the per-office breakouts, and the production-validated math.
2. Medesk Analytics: Practice Management-Linked PAC & LTV Dashboards
Most third-party analytics tools guess at a patient's value based on average procedure codes. Medesk does not guess because it lives inside the practice management system and sees every scheduled appointment, completed treatment, and recurring hygiene visit tied back to the original marketing source.
A DSO can see that patients sourced from a specific PPC campaign at Location A generate a $3,200 average LTV over 18 months, while the same campaign parameters at Location B produce half that value. The gap is not the ad copy. It is treatment presentation, scheduling efficiency, or local demographic mismatch, and the dashboard diagnoses it. The $150 to $300 PAC benchmark becomes actionable only when you measure it against the actual treatment revenue each patient produces, which is exactly what a PM-linked system delivers.
For groups that want reliability over novelty, a native analytics layer eliminates the data sync breaks, delayed CSV uploads, and attribution gaps that plague disconnected marketing tools. The patient record is the source of truth, and Medesk reports directly from that record. This matters most when a DSO is evaluating whether to scale a marketing channel across all locations or kill it, a decision that requires unshakeable numbers per office, not aggregated optimism.
3. ConvertLens: AI-Driven Predictive Targeting and Location-Level Forecasting

ConvertLens's predictive forecasting platform shifts marketing from reactive reporting to proactive budget steering, claiming to cut manual work by 70% and boost efficiency by 80% without independent verification through three core capabilities:
- Predictive patient acquisition engine: Analyzes local competition density, search volume shifts, and conversion patterns to flag offices facing rising acquisition costs within the next 30 to 60 days, enabling preemptive budget reallocation, e.g., shifting spend from a saturated suburban market to an under-tapped urban office with a lower forecasted PAC for a DSO managing 15 locations across three metropolitan areas.
- Integrated analytics: Tracks which campaigns drive consultations, case acceptance, and revenue, with real-time dashboards showing cost per patient and production ROI per office, turning last month's data into a steering tool for this month's spend.
- Dynamic allocation framework: Frames marketing as an allocation problem rather than a fixed line item, prompting a sharper question than reactive ROI reporting provides.
4. Swell: Reputation Revenue Attribution for High-Value Case Acquisition
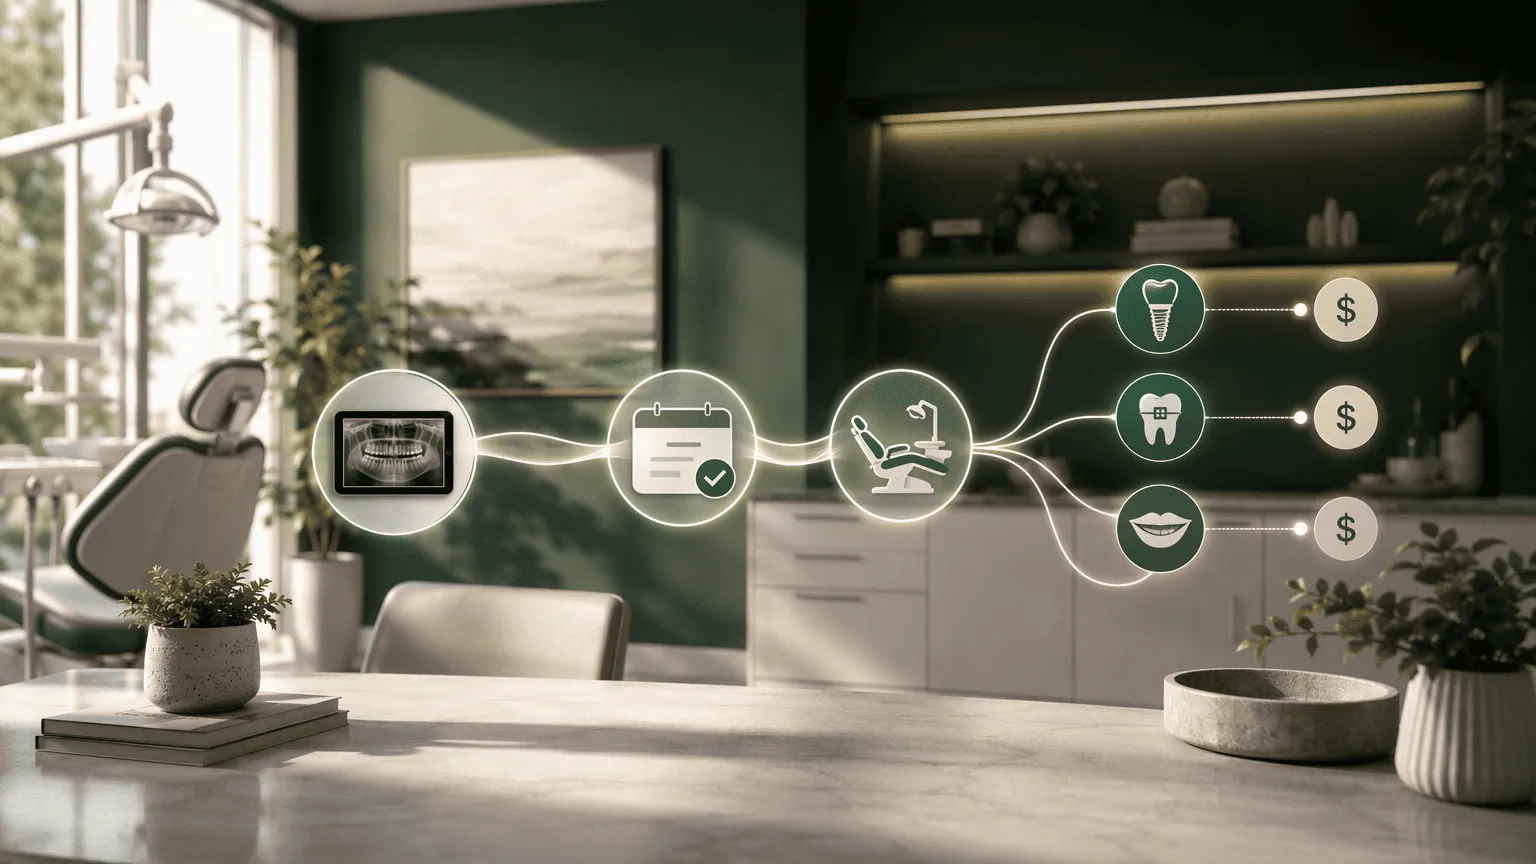
Most multi-location groups treat reputation as a brand metric and stop there. Swell attributes implant, ortho, and cosmetic case starts to the reviews and messages that drove them.
A DSO with 20 offices knows every location's star rating. What it rarely knows is whether a 4.8-star office converts more clear-aligner consults than a 4.3-star office. Swell follows the patient from review request to booked appointment to case acceptance, so the output is dollars per review channel instead of a sentiment score.
The limitation is real: Swell does not replace a call-tracking or paid-search analytics layer. It ties revenue to reputation well, but for the full picture you pair it with something like CallRail.
Swell gives you a number that the boardroom actually wants: the revenue a five-star review is worth at a specific location for a specific procedure. That number is easier to act on than a NPS trend line.
5. Dentrix Ascend with Integrated Analytics: EHR-Linked Patient Journey Tracking
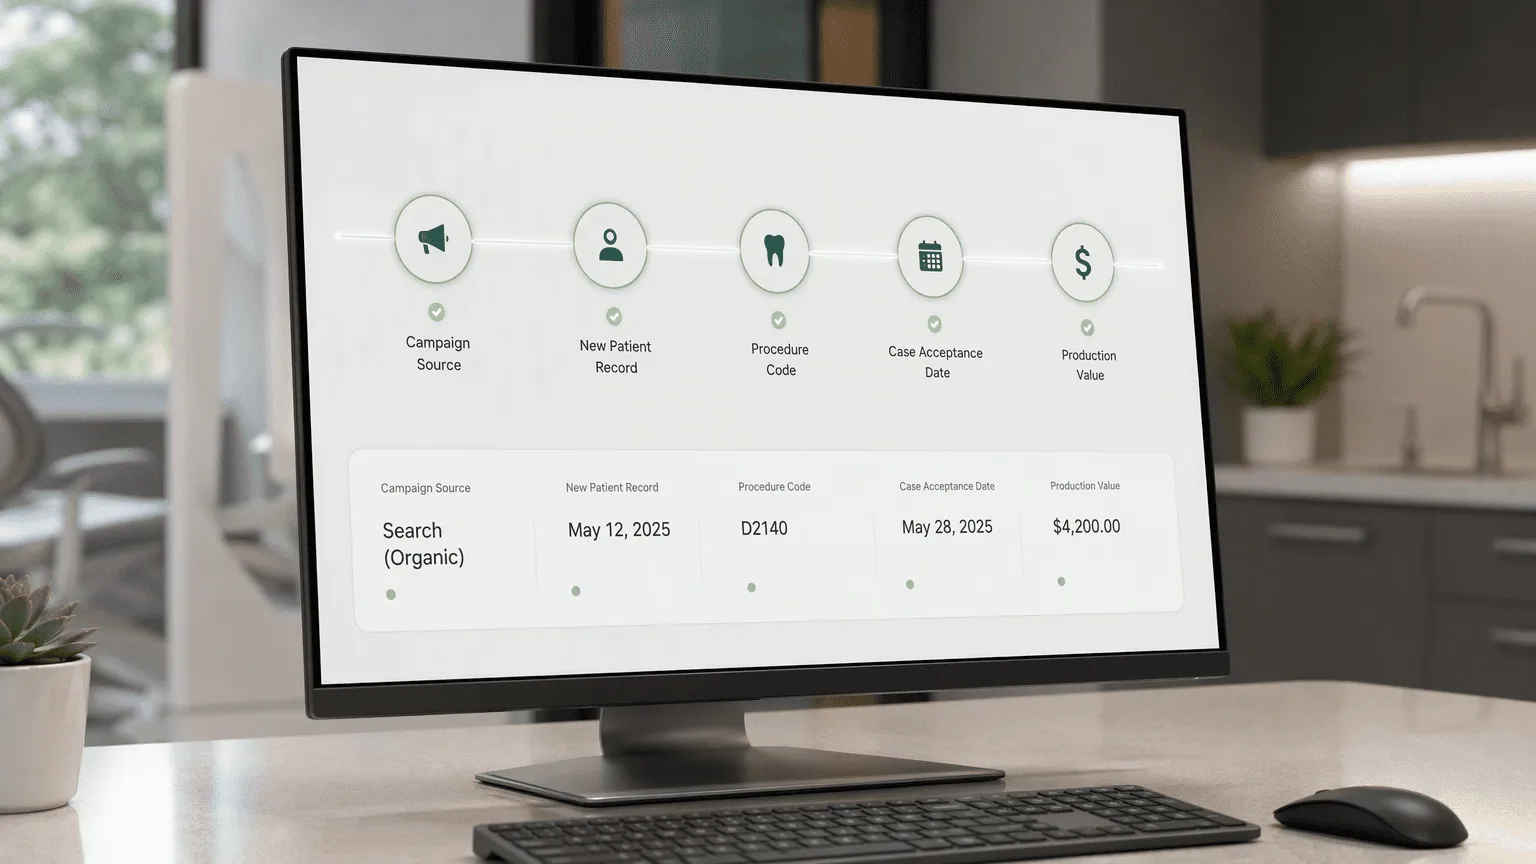
The cleanest way to stop guessing at marketing ROI is to connect your campaign data directly to the clinical record.
That means you can trace a new patient's origin source, procedure code, case acceptance date, and production value without stitching together siloed tools. The analytics module surfaces cost per patient and revenue per campaign against actual treatment outcomes, not just lead form fills.
The limitation is that native marketing attribution stops at what the EHR captures. It handles clinical and financial data well but does not natively manage call tracking or multi-touch campaign attribution across search and social. You solve that with an integration layer or by supplementing it with a dedicated marketing analytics platform, but for the core job of linking paid spend to actual production, this is the hardest data to fake.
6. Cardinal IQ: Enterprise DSO Centralized Reporting & Location ROI Comparison
Most DSOs acquire practices running different practice management systems. That fragmented backend produces incompatible data sets. Comparing true ROI location to location becomes impossible without someone manually normalizing the numbers. Cardinal IQ fixes this by aggregating data from multiple PMS and EHR brands into one centralized reporting layer.
| Feature | Cardinal IQ | PMS-Native Dashboards |
|---|---|---|
| Data Source | Normalizes data from multiple PMS/EHR brands into one standardized view | Reports only from its own database; excludes other locations on different systems |
| ROI View | Compares true per-location marketing ROI, overhead, and profitability side-by-side using unified metrics | Shows per-location metrics within a single PMS ecosystem but cannot compare across platforms |
| Best For | Enterprise DSOs with 50+ offices operating on two or more PMS platforms | Homogeneous groups standardized on one PMS |
| Operational Signal | Surfaces the office whose normalized profit margin is 11% while the group average reads 22% | Identifies production variance within its own data structure but misses cross-platform discrepancies |
| Implementation Burden | Requires PMS data mapping and standardized metric definitions across all locations | Functions natively with no additional integration for offices on the same PMS |
The centralized view earns its keep when a DSO's leadership team makes capital allocation decisions. Opening or closing an office. Renegotiating associate compensation. Scaling a new service line across 80 locations. Those calls need arithmetic, not anecdotes. A dashboard that normalizes ad spend, overhead allocation, and clinical production into one profitability metric per office delivers exactly that. The cost of skipping this normalization layer grows every time an acquisition adds a new PMS to the balance sheet.
7. Patient Prism: Lead-to-Booking & Show-Rate Conversion Rescue Tracking

Generating a lead means nothing if the front desk does not book the call or the patient no-shows. Patient Prism uses AI to analyze new patient phone conversations and web form inquiries, identifying missed booking opportunities for each office and quantifying the exact revenue slipping through your conversion gap.
The platform categorizes every lost opportunity by root cause: the call rang too long, the scheduler failed to overcome an insurance objection, or the follow-up on a web form was slower than 30 minutes. For a DSO running a centralized call center or distributed front desks, this per-office performance data reveals which locations need immediate intervention before their lead spend becomes a write-off.
Patient Prism then triggers a live intervention, routing unbooked callers to a call center or prompting immediate callback workflows, turning a documented failure into a rescued patient. A group spending $200 per lead across ten offices that books only 40% of those leads is functionally paying $500 per patient. Tracking and fixing that booking rate at each office is the fastest ROI lever most DSOs never pull, because they measure leads, not the moment the lead becomes a patient or disappears.
Conclusion
The tool you pick should map to the specific problem bleeding your margin. If your dashboards show clean-looking lead counts but your per-office profitability is opaque, start with Clinads for production-validated attribution. If your call conversion rates are unknown, deploy CallRail and Patient Prism together to measure and rescue what you are missing. DSOs juggling multiple PMS brands need Cardinal IQ to normalize the data before any ROI comparison is honest. Pick the tool that matches your current failure point, not the one with the most features.
Frequently Asked Questions
What specific ROI metrics should a multi-location dental group track for their marketing campaigns?
Track patient acquisition cost (PAC), cost per lead, lead-to-booking conversion rate, and patient lifetime value (LTV) at each individual location. Aggregated group metrics hide underperforming offices. Location-specific PAC surfaces which office requires intervention before it drains the group's marketing budget.
Which marketing platforms and software are best suited for tracking patient acquisition cost and lifetime value across multiple dental offices?
The right platform for your DSO depends on which gap you need to close first:
- Clinads: validates ad spend against actual PMS production data per office.
- Medesk: provides native LTV tracking linked to treatment history.
- CallRail: handles call attribution.
- ConvertLens: adds predictive forecasting.
How does call tracking and attribution work for a dental group with several physical locations?
Platforms like CallRail assign unique local and toll-free numbers to each office and campaign via dynamic number insertion on the website.
What are the key differences between a centralized vs. location-specific marketing dashboard for dental groups?
A centralized dashboard aggregates all offices into one group-level view, optimizing total budget allocation. A location-specific dashboard shows per-office PAC, conversion rates, and production ROI independently, revealing that one office is inflating group averages while another is quietly losing money on every patient.
HIPAA requires encrypted data storage, Business Associate Agreements, and protection of 18 specific identifiers. General marketing tools like standard Google Analytics are not compliant.
Sources
- Patient Acquisition Cost Benchmarks by Specialty in 2026 - www.medesk.net
- Dental Marketing Solutions Powered by AI | ConvertLens - www.convertlens.com
- Automatic Call Tracking For Dental Practices | Liine - www.liine.com
Want help executing this for your clinic?
Book a 30-minute call and we will map what a real ad engine would look like for your specific service mix.
Book a call